
As an event planner, operator, or venue professional, you know that behind every successful event are a lot of metrics. How many people attended? How long did they stay? What amenities did they use? This information helps you plan future revenue-driven events and boost guest satisfaction.
Did you know that Power Up charging tables can capture usage data and user demographics? With Power Up’s analytics packages, you’ll gain access to key metrics that help you better understand your audience and even track ROI.
What metrics are tracked?
Through state-of-the-art technology, Power Up’s charging tables collect usage analytics such as how many people used the table, how long they stayed at the table (also known as “dwell time”), and much more. It can also track demographic information about device users such as interest, age, gender, heritage, and income.
Why are analytics beneficial?
The analytics collected by Power Up’s charging tables are important performance indicators that can help you better understand your audience––and can make your next event even more successful.
Knowing when and where attendees are spending their time will help you place the charging unit in the most convenient place possible. Equipped with usage analytics, you can make informed decisions to plan traffic flow and hot spots. Demographic analytics have a huge impact on marketing and advertising efforts, allowing you to target exactly the kind of attendees you’d like to attract and draw more traffic to your next event.
The analytics that our charging tables collect can also help you calculate ROI on your investment. You’ll see how many attendees have used the table and took advantage of the incredible amenity—and left your event grateful for the opportunity to charge their device!
How can I access the analytics?
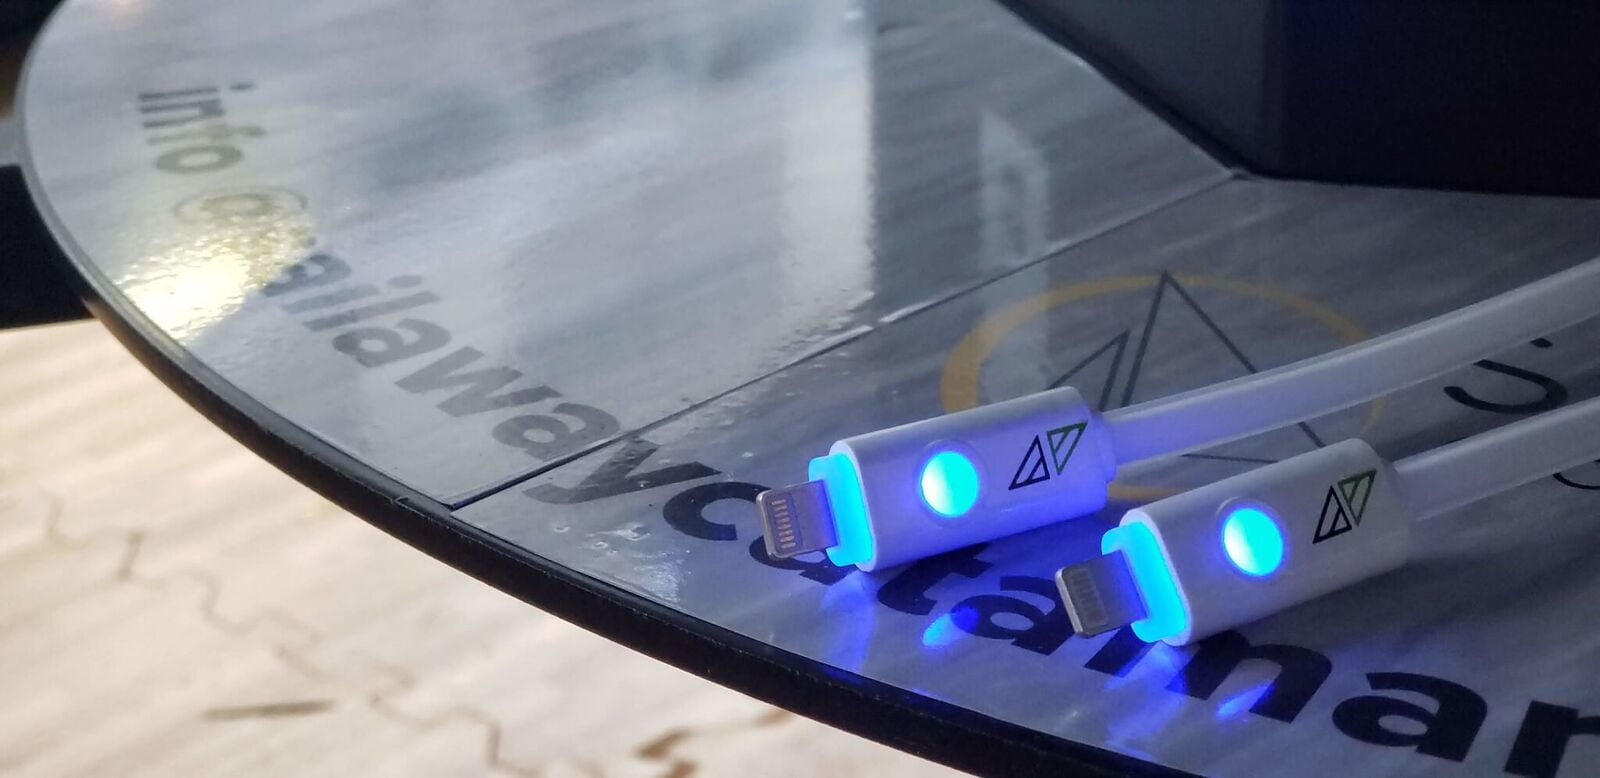
When you rent or buy a charging unit with our onsite/offsite Power Up Care+ annual package, you’ll receive access to the analytics dashboard. To view it, all you need to do is install an app (accessible on Apple and Android devices) and connect to the charging table via Bluetooth. You’ll be able to measure the total number of uses, as well as the date and time. This package also includes fast-charging cables, which feature thick gauge wire that charges devices faster than standard charging cables.
For an additional cost, you can add the Power Up Demographics package. This gives you access to all demographic information collected by the charging table.
Start Tracking Analytics Today
Ready to start tracking analytics with Power Up? Contact us today and our expert team will help you find the best charging solution and analytics package for your next event.